
The Industry Sells Forecasts. Investors Need a GPS.
Ask a portfolio manager what the market will do next year and a number comes back, maybe even a bounded range. An economist will give an answer with a probability, and a strategist will answer with a target, a timeline, and a list of catalysts. The investment industry manufactures a steady supply of predictions, along with tools for tracking how those predictions are faring and how they change from time to time.
We see why buyers want these despite how dismal the practice has proven. Almost any allocator, advisor, or retail investor will pay real money for a legitimate and legal inside track to what happens next, and the industry organized itself to sell what it can: year-end targets, rate calls, recession odds, and sector rotations timed to the quarter. Some of it will inevitably prove correct given the sheer spectrum of calls. Knowing which ahead of time is another matter.
Philip Tetlock spent two decades documenting how expert forecasters perform, first in Expert Political Judgment (Princeton, 2005) and then in Superforecasting (Crown, 2015). He found that calibrated forecasting is possible over short horizons for questions with stable base behavior, and that accuracy decays as the horizon lengthens. In our experience that decay is sharpest for exactly the questions investors would pay the most to have answered: when does the regime change, when does the thing that has worked stop working, and when does it resume.
We chose a different focus by putting our effort into more fault tolerant information: where we are now, where the likely corners lie, and how fast we are moving toward one.
What a GPS actually knows
A navigation system reads the road, not the car. It knows the general flow of traffic, rush hour and midnight, and it knows which stretches have jammed before. It does not know how much gas is in any tank, which route the driver prefers, or whether the vehicle will break down in transit. And it cannot know that an accident has delayed a particular route until after the accident occurs, is reported, and the system updates.
The market equivalent is knowing the beta environment without being able to resolve the idiosyncratic outcome for any particular security. The vehicle-specific information lives with the driver, not on the map, and no amount of map improves it.
Weak prediction is the point
Any readout of where the market stands today implies something about tomorrow, and that is the only prediction we make. If we classify the current environment as low-dispersion and trending, we are stating that it stays that way until we observe enough change to declare a new environment and decide whether the change is noise or a turning point. The prediction is loose by design. Periodic updates give us a sense of path, and comparison to similar past episodes gives us a basis for the loose prediction and a range for how it might resolve.
Turning points and failure
Consider two ways to hold a view through a turn. The first is a thesis: rates will fall by the second quarter, so long duration and small caps will lead. The second is a readout that keeps reporting still restrictive, no change in trajectory, until it can report something else.
Many investment theses carry discrete conditions that, once breached, invalidate the thesis, and a turn that fails to arrive in the expected form is one of them. If the cut comes in the fourth quarter instead, or arrives with a recession attached, the thesis was wrong even if its ingredients were right, and the investment built on it has already paid for the error. The GPS readout has no such condition to breach. It was never right or wrong about the second quarter. It kept updating, and it stayed useful while the question was unresolved. That asymmetry is why we spend our effort on the fault tolerant instrument when the uncertainty is real.
A market GPS in practice
Our firm publishes a market weather system built entirely from public data. We draw on data back to 2000, where most of the current market structure begins, and look for clustering patterns associated with bad events: the Dotcom meltdown, the Global Financial Crisis, COVID-19, and the 2022 rate shock among them. We never expect history to repeat, but we do expect cluster patterns, measured by density over a period, to surface the rhymes as a warning system.
The system weighs a set of related factors and issues warnings with historical precedents and the observed range of prior outcomes attached. It does not need to be perfectly accurate. It frames current data through a historical filter and reports how comparable episodes resolved. It is decision support, not an oracle. The instrument orients to help the manager make the judgment.
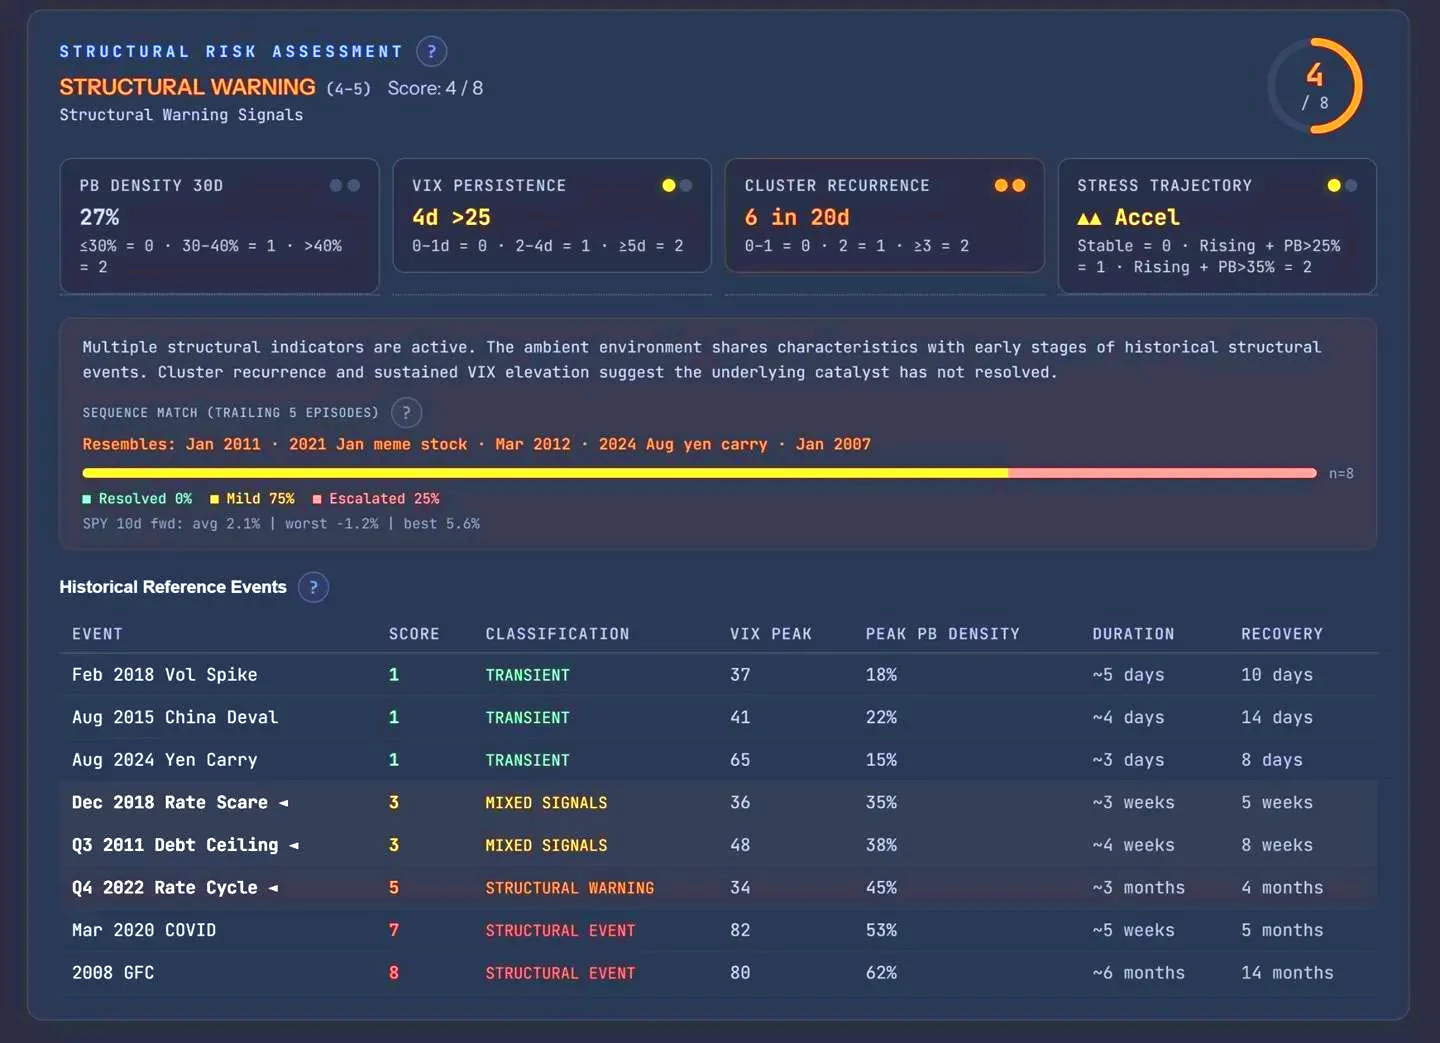
On March 19, 2026, the system declared a structural event warning, meaning the market was undergoing stress that was likely more than fear. We acted the following day.
On April 20, 2026, it declared that a low-grade structural event had taken place.
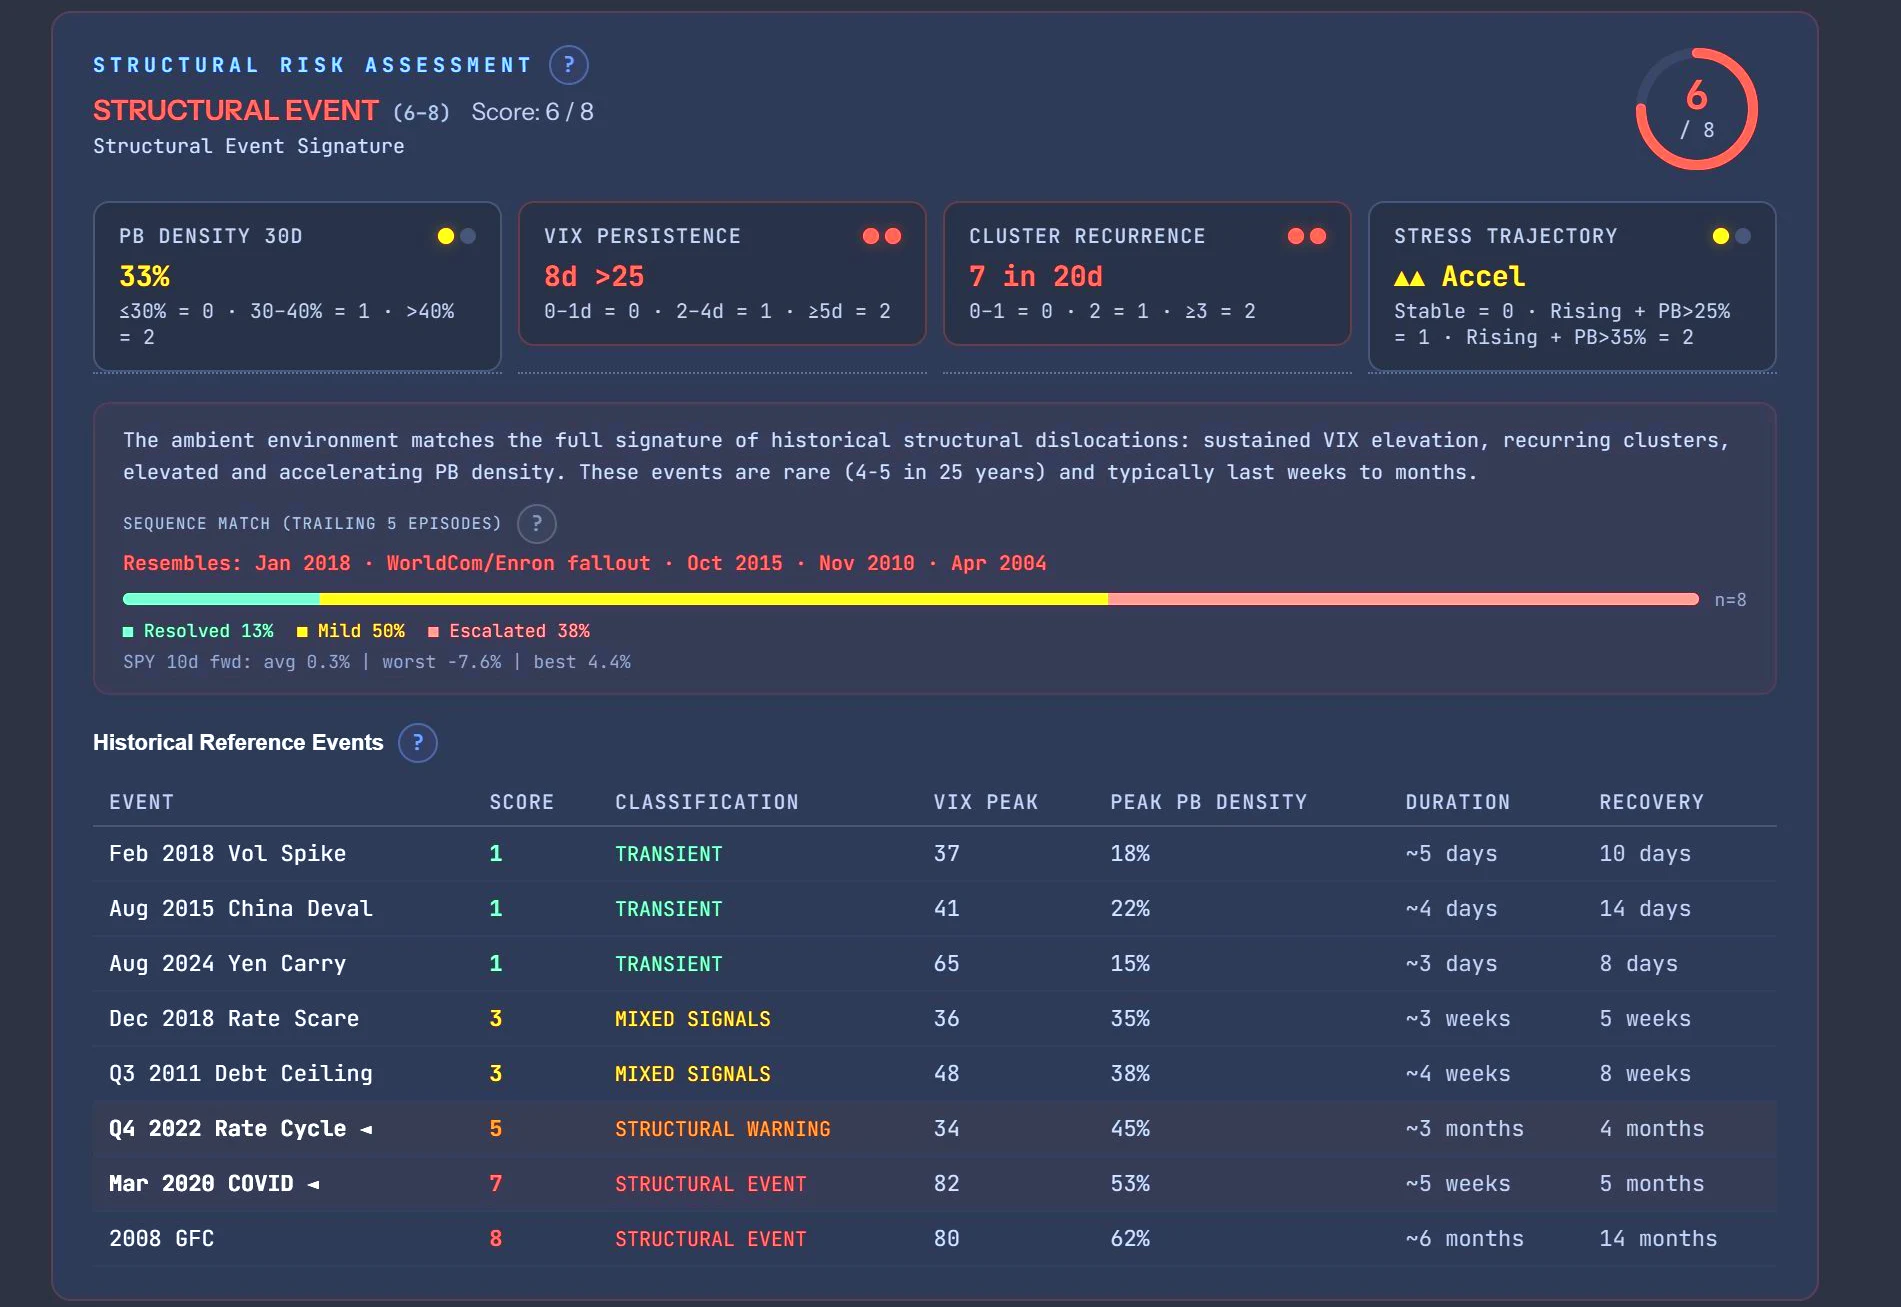
The system does not read headlines. It never saw the Strait of Hormuz disruption or the oil price rise that followed. What it saw was the density of high-volatility days growing, and it reported that growth over time as a series of rising structural warnings. We did not time the market, nor were we trying. By March 19 much of the drawdown had already happened, but we did not yet know whether to classify the event as fear or as a structural obstruction for the economy going forward.
Once the warning sounded, we judged it prudent to move, and on March 20 we did. On April 20 we acted again, based on our own judgment that oil prices would remain elevated through at least December 2026. While the system identified a changed environment, the analysis about oil and resulting choices were ours.
The value to us was a second confirmation that what we were reading was most likely a real problem, and not one on the scale of the Global Financial Crisis. We trimmed and moved to a more barbell holding in equities and fixed income while the elevated risk persists.
A portfolio GPS in practice
Navigating severe conditions takes two readings: an accurate map of the road, and a real-time sense of how one's own vehicle handles it. The weather system is the first. For the second, we built a monitor to track how our strategy moves through the conditions the first one reports.
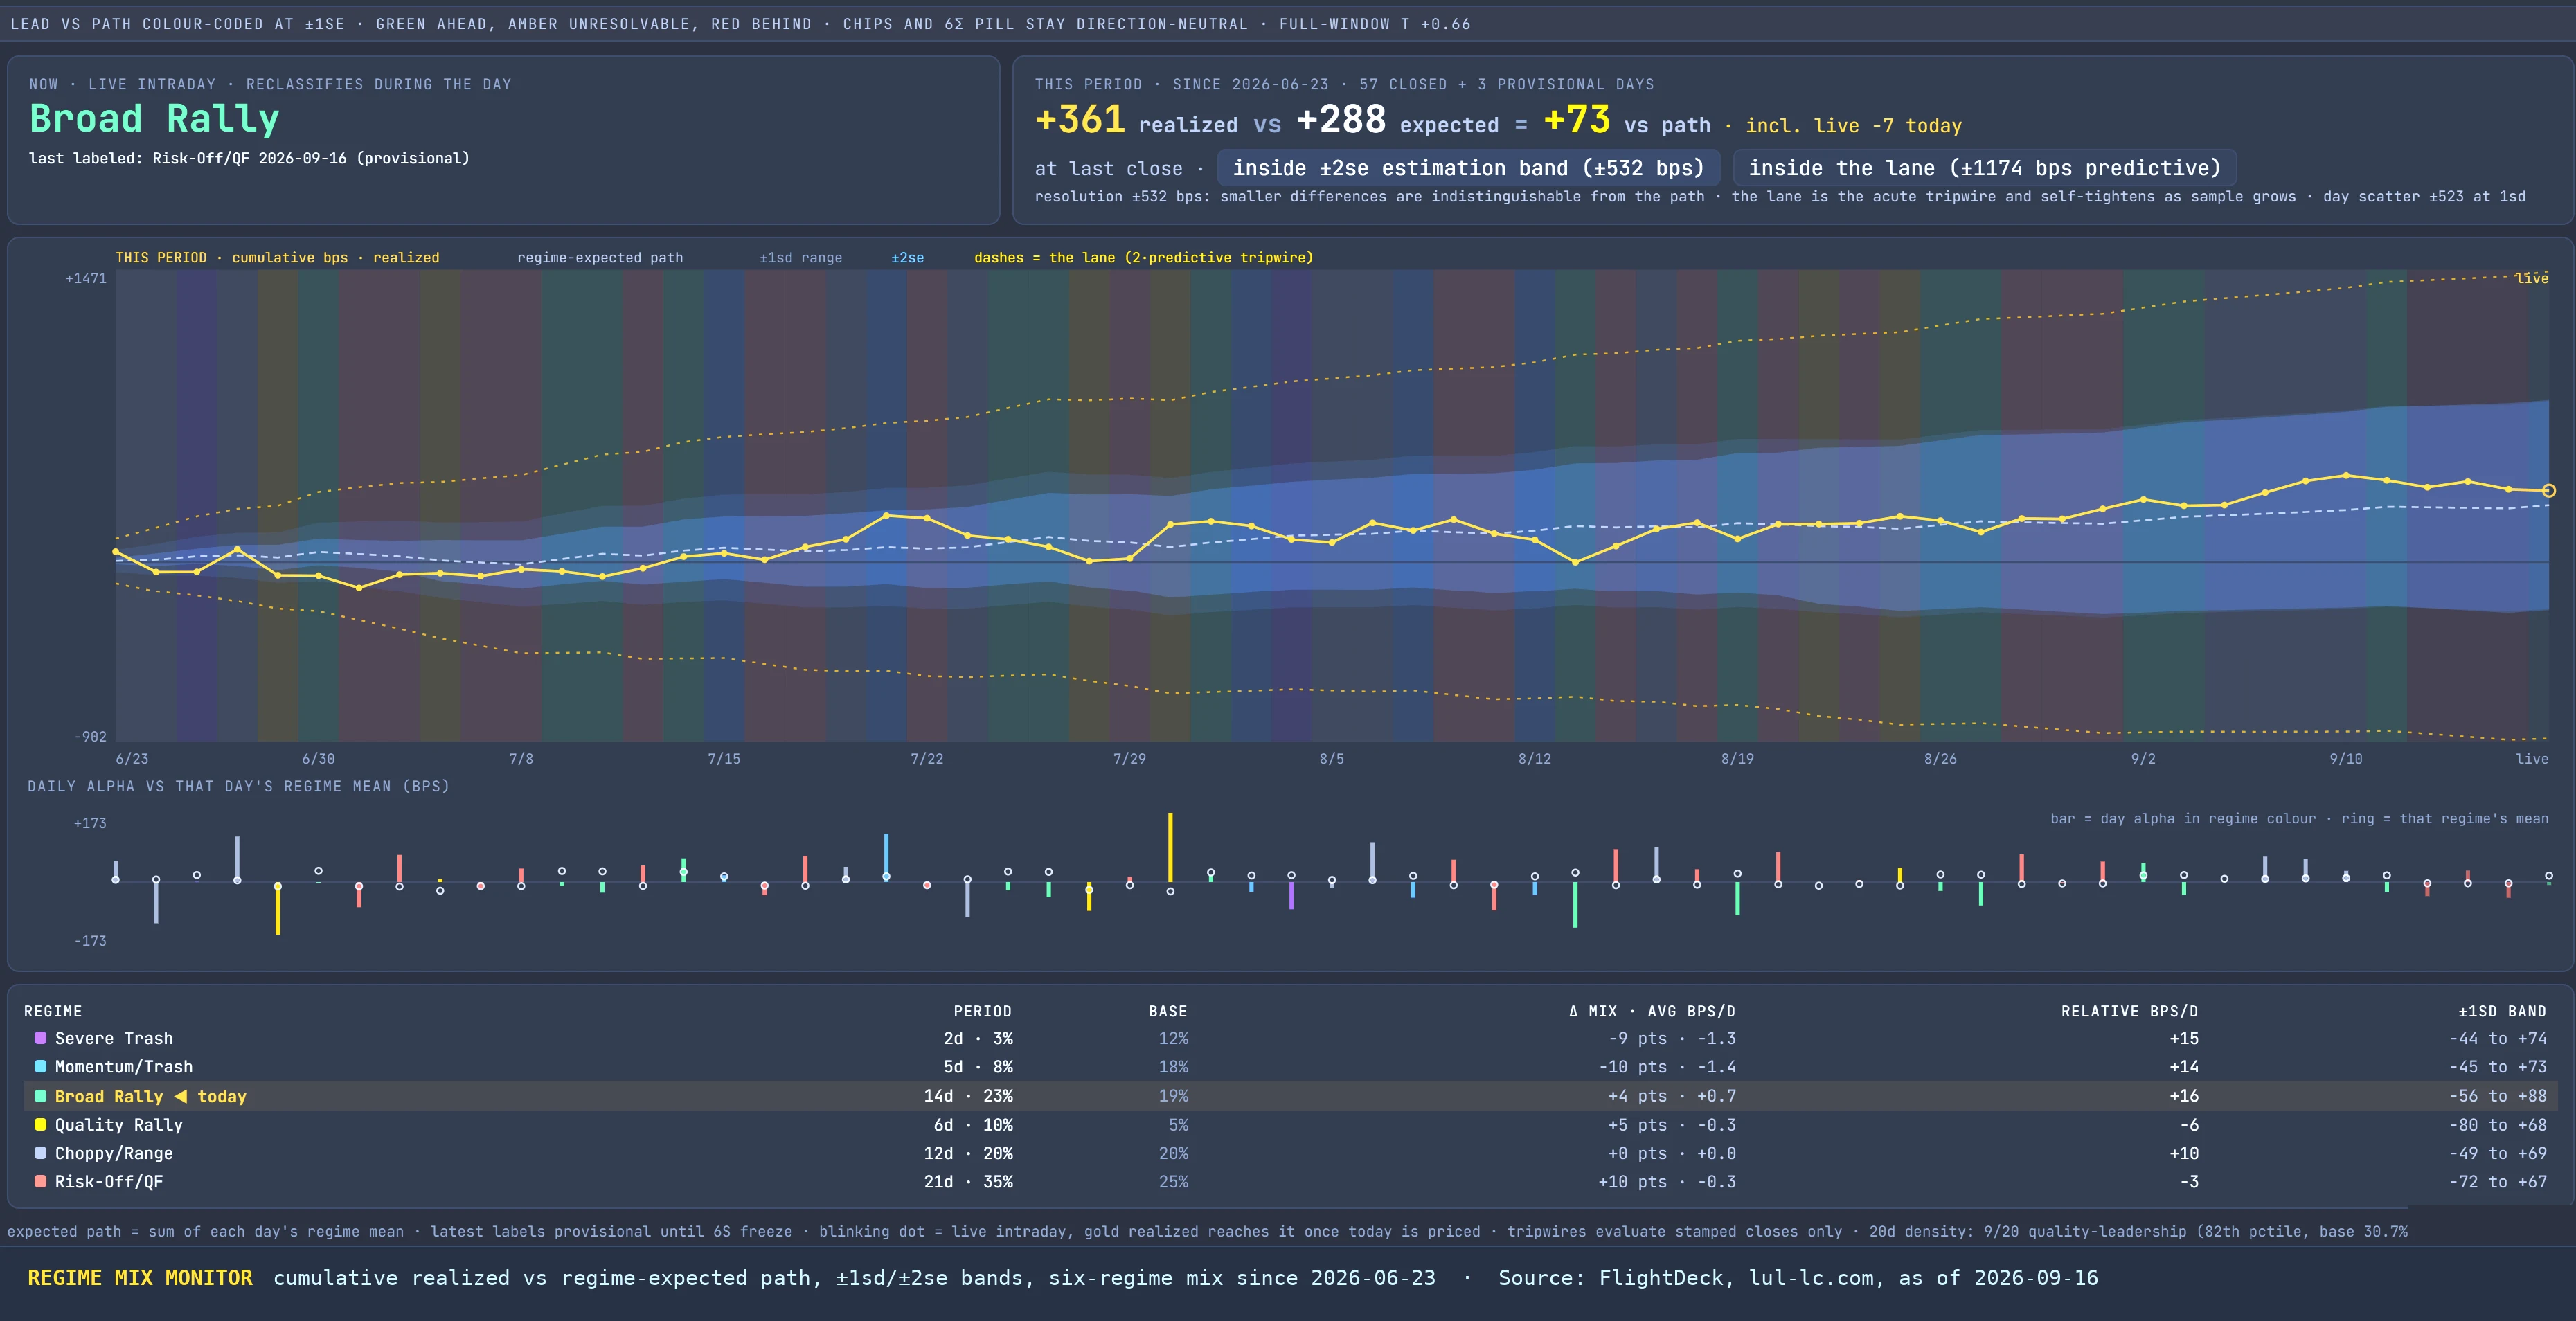
Every trading day is assigned to one of six market conditions, defined by the size of the market's daily move in standard deviation terms, three on the bull side and three on the bear side. For internal use we gave them more descriptive names, and the chart uses them. From most speculative to most defensive: Severe Trash (Bull I), Momentum/Trash (Bull II), Broad Rally (Bull III), Quality Rally (Bear I), Choppy/Range (Bear II), and Risk-Off/Quality Flight (Bear III). Quality Rally sits on the bear side because on those days investors sell off lower-quality names and buy quality, and since quality is also our bias, we tend to experience those days as a rally. At the speculative end, the lowest-quality names lead a sharp up day. At the defensive end, money leaves risk altogether.
Each label carries an expected daily result for the portfolio, drawn from the strategy's own history under that condition. The monitor therefore knows what a Bear III day should cost and what a Bull III day should contribute before the close, and it judges the realized result against that expectation rather than against a feeling. A reading inside the bands is noise. A reading outside them is a prompt to investigate, because either the market has changed or the portfolio has.
Two caveats belong here. The condition boundaries are set from the measured sample rather than fixed in advance, so they shift slightly as the data set grows. And the expected results are the strategy's own trailing record, so the monitor is a diagnostic of consistency with our past, not a tested forecast of our future; and we treat it that way.
How they work together
With one reading for traffic and one for how the vehicle handles, we have better information on which to base judgments than a golden gut or a partial reading paired with a feeling about what comes next. Most of all, we use the two for behavioral discipline because everyone wakes up with a variety of feelings that should have no bearing on investing choices.
What an advisor can do with this
None of this requires our tools. The daily move of any broad index, sorted into sigma bands, is enough to start. What it requires is a change in the question. Clients ask what the market will do, and the honest answer to that has never satisfied anyone. A regime readout lets the conversation move to where we are, what stretches like this have looked like before, and how they resolved, which is a question an advisor can answer and a client can use. It also produces a record. Six months later the review is not about whether the forecast was right but about whether the conditions changed and whether the response was proportionate. That is a better conversation for both sides of the table.
If no one can see around the corner, an orientation system for identifying the corners and our approach to them improves the quality of the decisions we make when we reach them.