
Risk · how we manage risk
Built to spread risk, watched every day, stress-tested on what we actually hold
Every portfolio is built to spread single-name risk, watched against published thresholds every trading day, and stress-tested on its actual holdings rather than on a back test. This page shows how, and the next one shows where the design is expected to struggle.
01 · Construction
How the book is built
Diversification is designed in, not added afterwards. No single name, sector or signal can dominate the portfolio.
- 2 models
Two independent models, one forward-looking and one backward-looking, must agree before a stock is bought.
- 22 names
Equal weight, two in each of the eleven sectors, US-traded including ADRs.
- ≤ 90 days
Every holding is replaced within 90 calendar days, as the signal behind it fades; the average hold is about 50 trading days.
Beyond the long-only book
Hedged alternativeIn addition to Alpha Convergence, AC Market Neutral holds the same long book and shorts RSP against it, on margin, with the short sized so the book’s beta to RSP is close to zero and adjusted between rebalances as the long book drifts. It is managed by our sister company, Leyland Cypress.
02 · Monitoring
What we watch every day
The Market Weather System classifies each trading day as it unfolds, and the Storm Center identifies what kind of market stress is most likely under way by matching recent trading days against 26 years of history. Five published thresholds tell us when a position, or the whole book, needs a closer look.
Today’s regime
AO
Alpha Opportunity
SPY +0.52%
Environment
Normal
VIX 16.8
Breadth
NARROW RALLY
Large caps leading, rest lagging.
SPY +0.52% RSP +0.36%
Selective strength -- mega-cap driven.
PB density (20D)
10%Risk appetite
RISING TIDE
All assets advancing — broad inflows across risk and safety
IWM +0.39 HYG +0.16 TLT +0.16
Broad demand — watch for reversal if driven by positioning
Sectors
- Tech+1.7
- Indust+0.9
- Utils+0.6
- Fins+0.6
- Discr+0.4
- Matls−0.1
- Energy−0.3
- RE−0.4
- Staples−0.6
- Comm−0.7
- Health−0.9
Updates every 60s during market hours
weather-system →- VIX
- Above 30 for more than five trading days, a closer look at equity exposure. Above 40, an immediate defensive assessment. When VIX runs very high, we recommend a defensive reallocation.
- Drawdown
- Near −10%, defensive reallocation is evaluated. −20% is the risk-tolerance limit. We will advise when we recommend any shift in allocation, unless we directly manage the entire portfolio, in which case we undertake the reallocation on our client’s behalf.
- Structural event
- Our Storm Center scores four signals, 0 to 2 each: how often the last 30 trading days were Pure Beta, how many of the last ten closed with VIX above 25, how often stress clusters recurred within 20 trading days, and whether stress is accelerating. A score of 6 or more declares a structural event: conditions matching historical dislocations that lasted weeks to months. 4 to 5 is a structural warning.
- Model correlation
- Below −0.1 signals extreme stress; above +0.3, the models are losing independence. Either brings a closer review of positions.
- Regime change
- Four consecutive weeks of material economic change in one direction before a shift is called, so one fear spike does not move the book. That is only one marker: our exclusive Storm Center warning system and the live Market Weather System also feed the decision. We use a combination of signals to decide whether an event warrants a reallocation.
These thresholds inform discretionary decisions; they do not trigger automatic trades. Where we manage the whole account, we make a defensive reallocation ourselves, at our discretion. Where we manage only the equity sleeve, we recommend the client trim exposure to us for a while: reduce, not sell. Telling temporary volatility from a genuine change of regime takes judgment. See the Market Weather System live
Inside FlightDeck · live evidence
Evidence of significance beside the strategy’s live record
A record alone cannot tell skill from luck. Statistical Validation, factor attribution and the Pure Beta / Alpha Opportunity table can, and FlightDeck runs all three right beside the live record every trading day, publishing the result whether it is favorable or not. Each panel carries its source date.
Alpha Convergence · cumulative return
Through 20 Oct 2026* Net figures deduct a 2% model fee, the highest fee we charge. Our fees range from 1% to 2% a year, depending on the size of the account. The full schedule is in Form ADV Part 2A.
| Alpha Convergence total return | Gross | Net of 2% model fee* | RSP, total return |
|---|---|---|---|
| Since inceptionstrategy record, from 27 Jun 2025 | +56.8% | +52.8% | +22.3% |
| Last twelve monthsfrom 21 Oct 2025 | +36.3% | — | +15.5% |
Cumulative, as of 20 Oct 2026. Includes 27 Jun to 18 Aug 2025 on firm capital before client accounts began. Net deducts a 2% model advisory fee*, the top of the fee schedule, not the fees actually billed. The statistics that follow are computed on gross returns. Past performance is not indicative of future results.
* Net figures deduct a 2% model fee, the highest fee we charge. Our fees range from 1% to 2% a year, depending on the size of the account. The full schedule is in Form ADV Part 2A.
- Alpha t-statistic · gross · HAC2.38Newey-West HAC, q = 4
- Trading days on record331Strategy record since 27 Jun 2025 · includes 27 Jun to 18 Aug 2025 on firm capital
- Information ratio · gross1.91Against RSP · tracking error 10.1%
- p-value · gross · one-sided · HAC0.0086Not the probability of future success
FlightDeck · as of 20 Oct 2026. Active return is measured against RSP total return. Significance is measured gross, as the SEC marketing rule permits for a statistic of skill. Computed on gross returns; does not reflect the deduction of all fees and expenses. Net total returns for the same period are shown in the Alpha Convergence total-return table above. The primary test is one-sided (is active return above zero?); the 95% interval is two-sided, the more conservative choice. These are observations from a short record, not a forecast.
Significance over time
Gross · expanding window from day 60Statistical ValidationFactor attributionThe Pure Beta / Alpha Opportunity table
Source: FlightDeck’s published data. This page checks for updates every minute; the figures change when FlightDeck publishes a new trading day. Past performance does not guarantee future results.
The command center
From the backstage tour · recorded 11 Oct 2026The team sees market conditions, portfolio performance and regime changes together, in one workspace. The panels above are its public, live readings; this is the screen behind them. It is a partial screen: the command center has many more pieces and pop-outs than you see here, and the regime-mix monitor below is one example of the extra tools that are part of it.
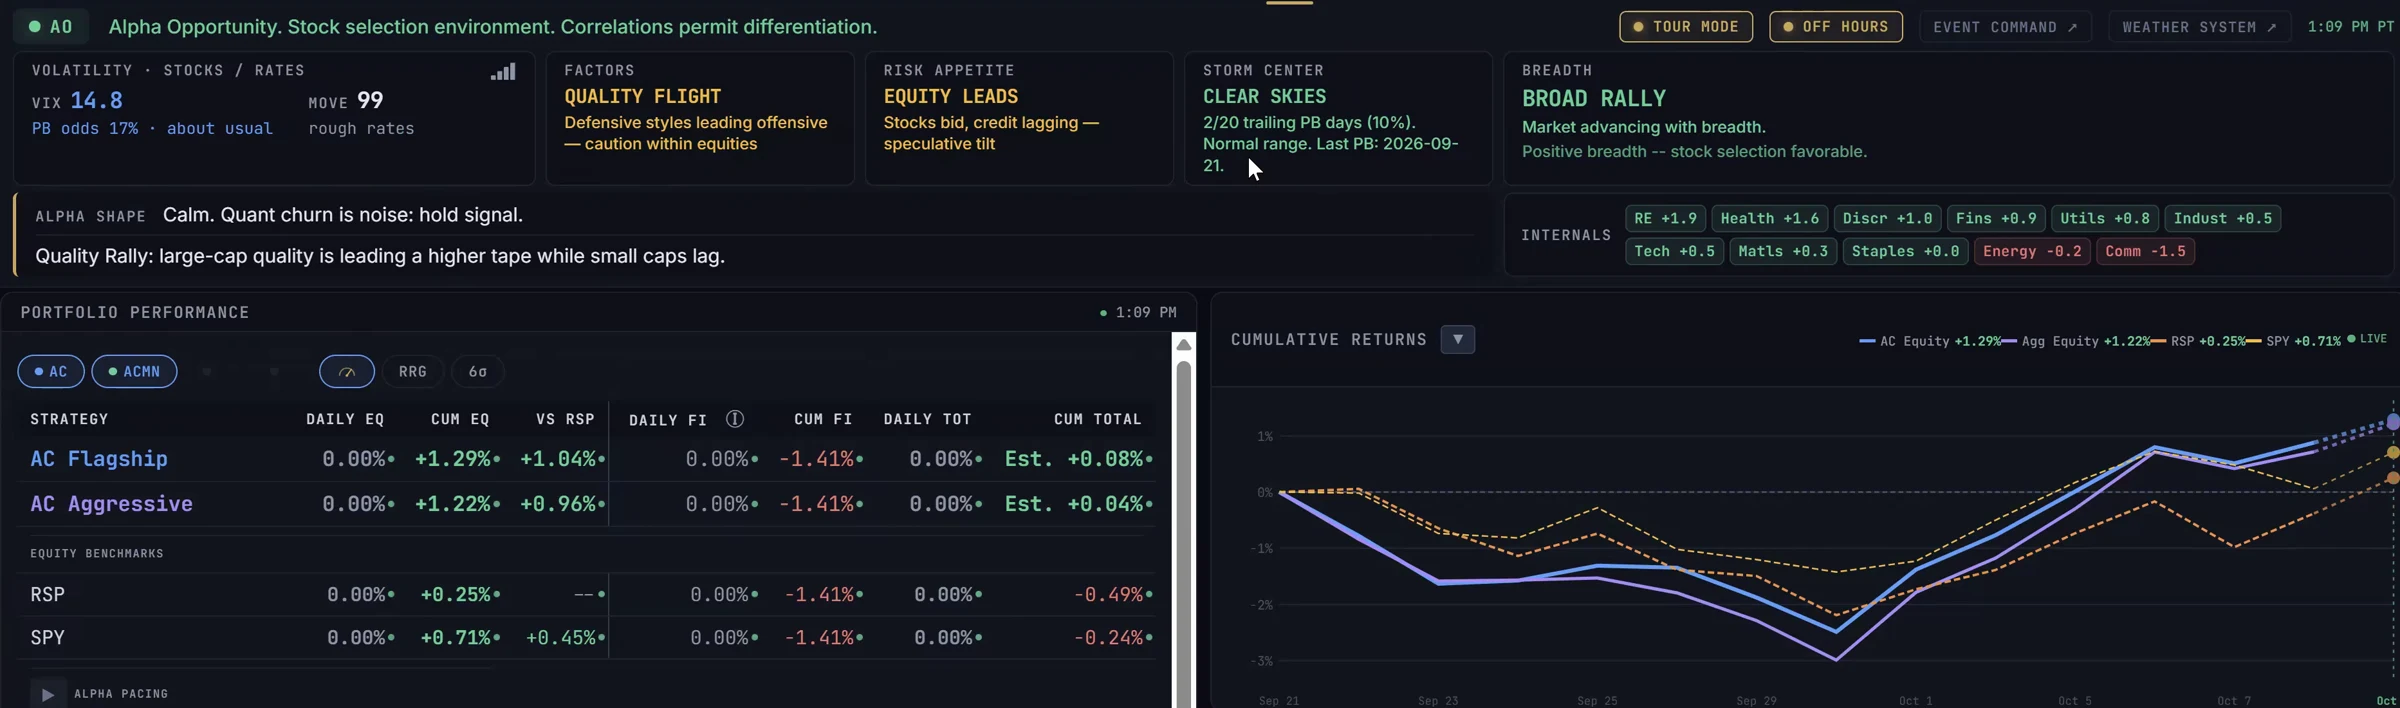
Inside the regime-mix monitor
From the backstage tour · recorded 11 Oct 2026This monitor and the command center are not public: they are part of the backstage tour, shown here as a look behind the curtain. The team compares realized excess return with the path expected for the market’s regime mix; a departure prompts investigation rather than an automatic trade.
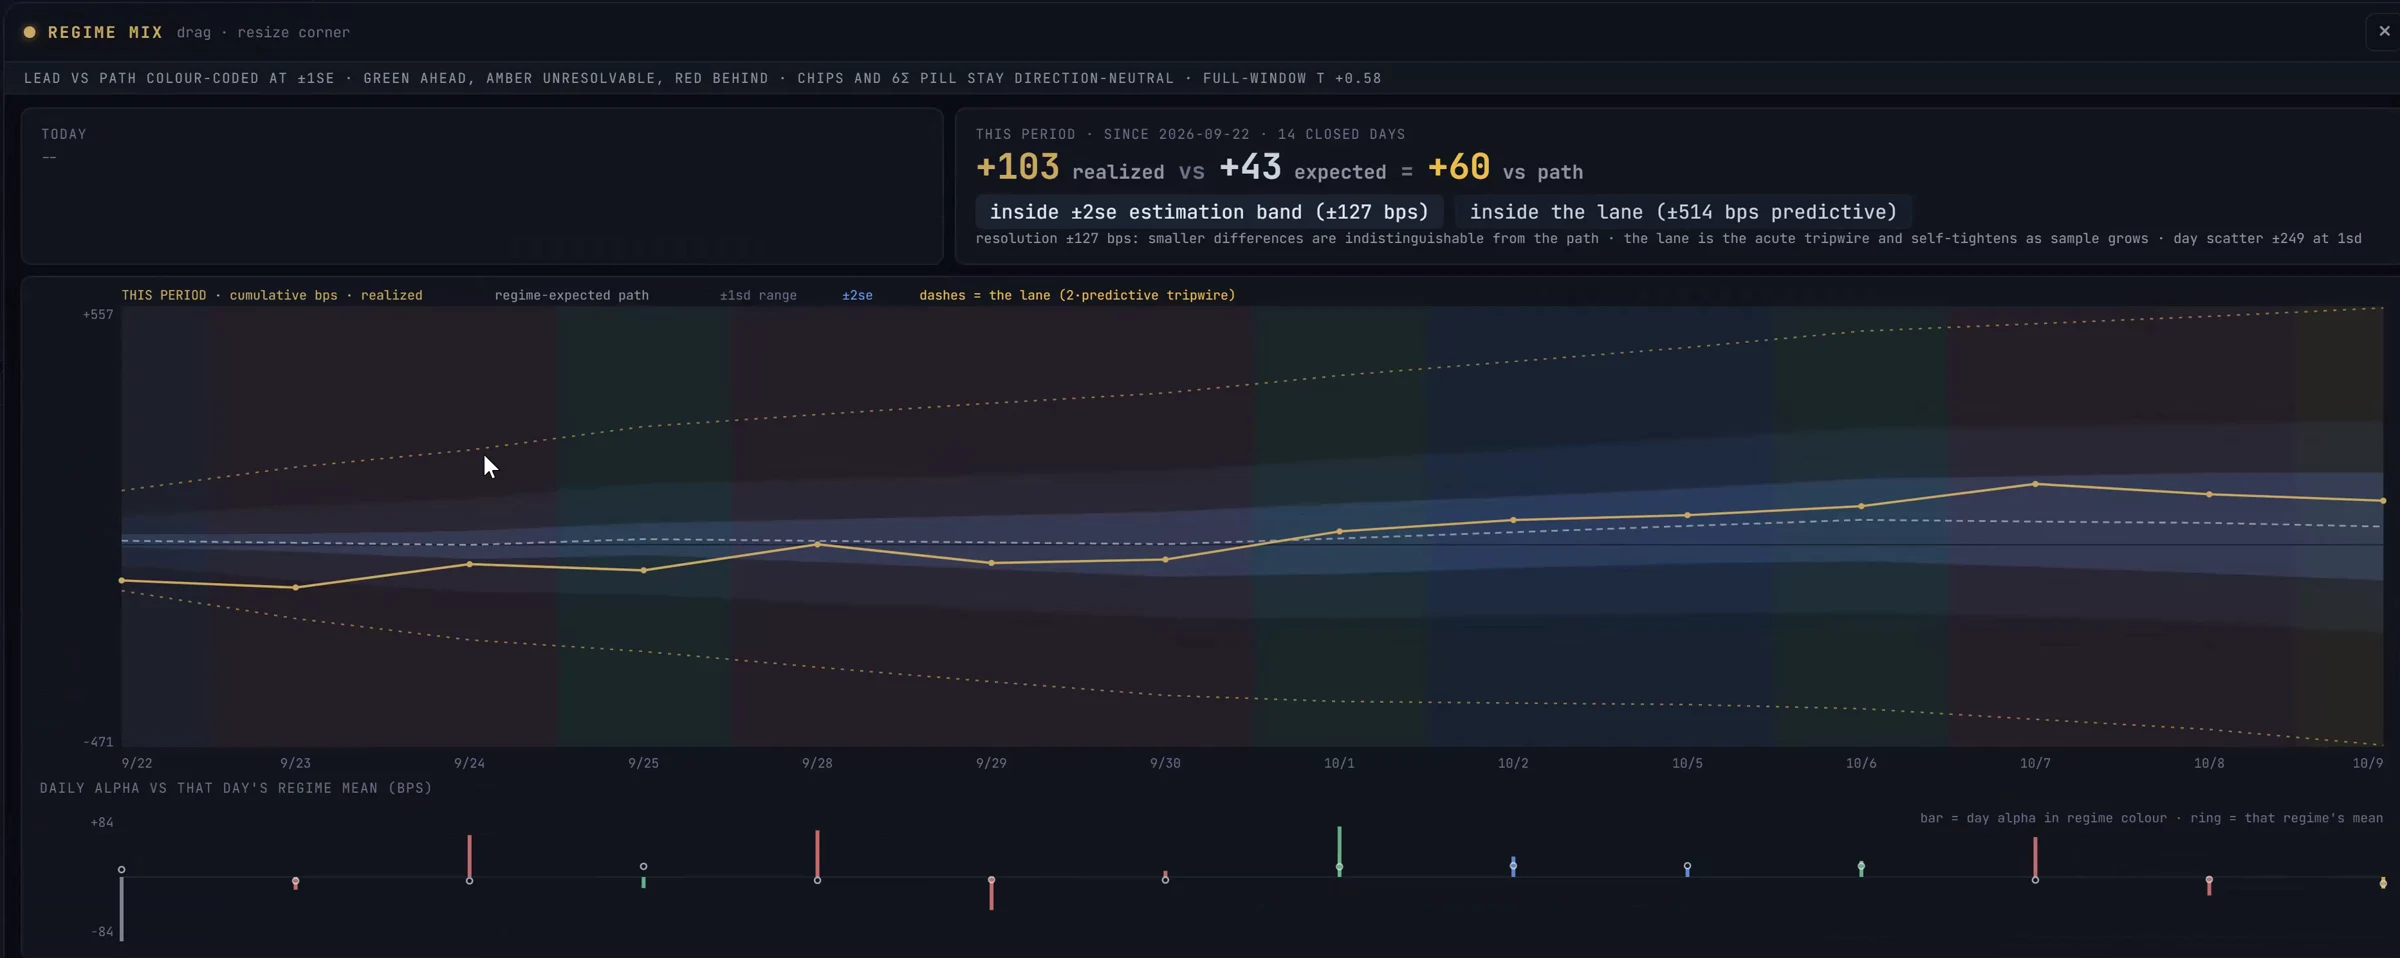
03 · Stress testing
Today’s holdings, through history’s worst
Scenario Replay runs the portfolio we hold today through historical crises and reports projected drawdown, months to recovery, and the density of Pure Beta days: the days when the market, not stock selection, drives returns. It is not a back test; it never rewrites the past with today’s rules.
04 · No spin
We dare to show the bad with the good
How things are, not how we wish them to be.
-
Maximum drawdown · as of 20 Oct 2026
−8.5%
Since inception, peak to trough, read from the same feed as the homepage.
-
Every period, as it closes
Every cycle is published as it closes. A period that trails RSP appears here unchanged.
-
Case study · Telemetry 014
A short-seller attack took one holding down about 45% over three trading days. Construction kept the damage from spreading.
05 · Operational safeguards
Client assets stay at Schwab, in the client’s name
Held at Charles Schwab, not by us: we have trading authority and no custody. Account values, returns and billed fees are reported through SS&C Black Diamond, reconciled to custodial records, and the Chief Compliance Officer reviews and approves marketing and performance presentation.
Where should it struggle?
Known limits: what the design trades away, and what it has not yet facedBackstage tour
See it running live
A live screen-share of FlightDeck with Mark Tennenbaum, CIO: the command center driven in real time, how today’s market is classified and what the book does about it, and the record with the tests behind it.