

Tactical Situation Report
(Weekly Portfolio Intelligence)
Super Summary:
- US and Iran still not talking much, and oil is still moving through Hormuz at a higher rate despite tanker attacks
- Hiring slowed, but unemployment is still low at 4.2% with little wage pressure on inflation: a solid job market
- Brent oil prices around $100 per barrel keep the Fed cautious. Higher interest rates are persistent for now
- Our average account is up 21.5% so far this year, with Alpha Convergence up 29.82% against the S&P 500 at 12.86% and the equal weight version at 9.49%
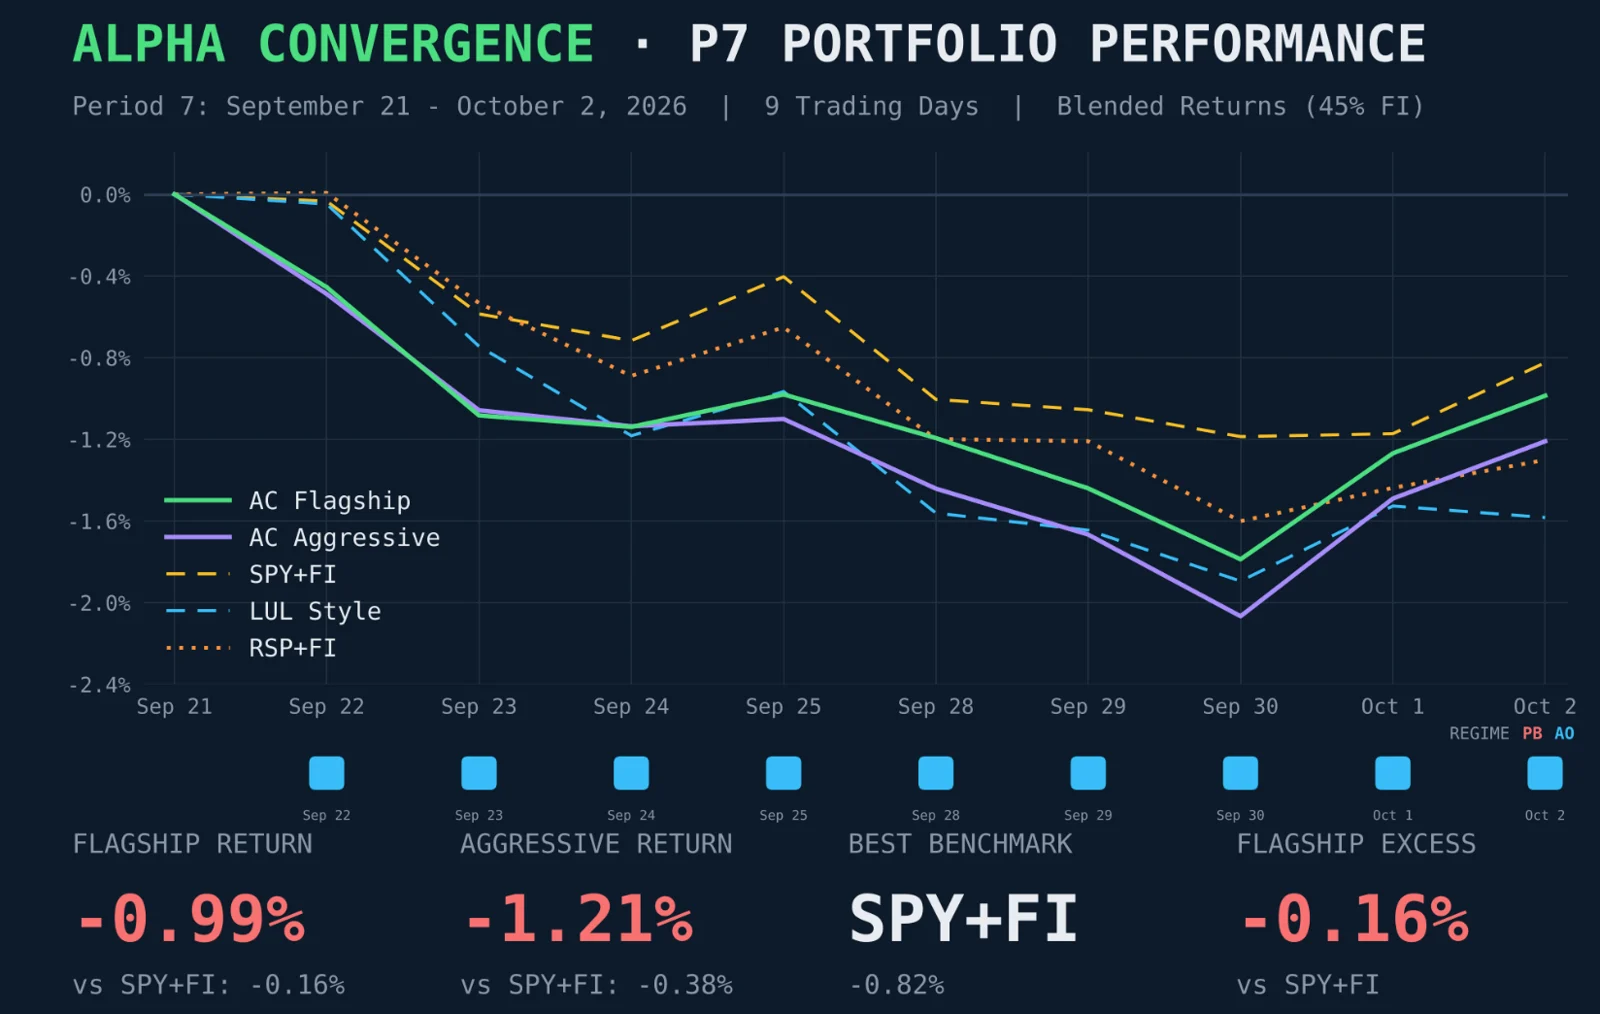
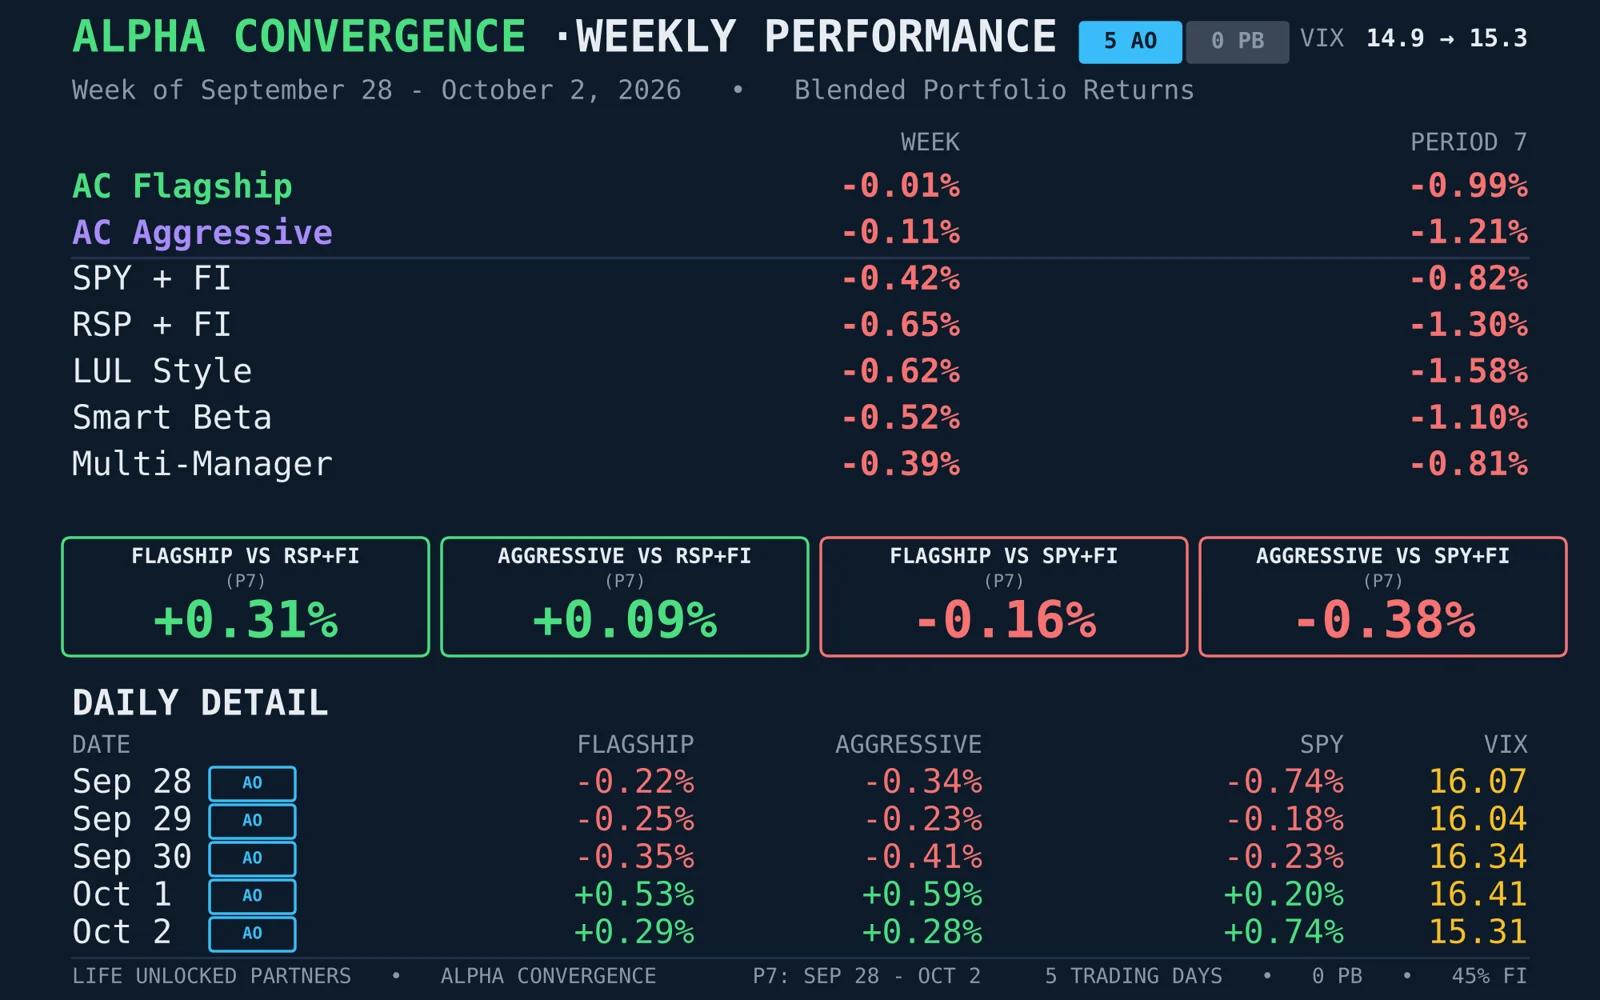
Our results since last rebalance on September 22nd.
On The Move
Another off week for the market where our pattern found its footing and we're ahead of our benchmark again. This won't be our last rocky moment, and it's important that we examine these for lessons to take forward. Probably the biggest for most portfolio managers and investors is not panicking until it's time to panic. That means holding discipline when noise drives stocks the wrong way for a while, which may prompt bad feelings.
The two rough weeks were relatively easier for us because we have tools to tell us whether it's time to panic (take defensive action before a worse thing happens). That simple judgment is still tricky for many managers who mistakenly go on tilt.
Here's how it usually starts: we make a judgment call like holding a portfolio 5 days longer than we'd like and it costs us. Now, we might feel compelled to take a new risk to make up for that mistake (without even taking the time to measure whether it was a mistake because we do not even have the data yet). It's the same trap poker players fall into after a bad beat. The loss makes them play more loosely to win it back, and that typically leads to an exit from the table without money or chips. That's tilt.
As much as we have strong technology for picking a portfolio, we further surround it with tools to tell us when it's time to panic, and that's a huge relief. With our tools reassuring us, we can focus on why we feel the way we do without messing with what's working.
What It Means for Us
We basically broke even in stocks as the market fell and that flipped the script. We are watching momentum-based stocks surge while value stocks (stocks at a discount to fair value) pull back: they're trading places. Since our portfolios are designed to perform in momentum and value environments, we typically catch a positive wind from one as the other wanes and then we are back in the flow. It's actually satisfying to watch it move back and forth as market trends and themes shift.
As always, we are here, laser-locked to watch and watch and watch and watch. No tilt! And watch and watch and watch.
From the bridge.
Disclaimer
This newsletter is provided for informational purposes only and represents the current opinions of Life UnLocked Partners ("LUL"). It should not be considered personalized investment advice or a recommendation to buy, sell, or hold any security or adopt any particular investment strategy. The information presented is based on sources believed to be reliable, but LUL makes no representation as to its accuracy or completeness.
Past performance is not indicative of future results. All investments involve risk, including the potential loss of principal. The investment strategies discussed may not be suitable for all investors. Each investor should review their investment objectives, risk tolerance, and financial situation with a qualified advisor before making any investment decisions.
Performance data presented reflects the specific LUL strategies described and may not reflect the performance of any individual client account, which will vary based on account-specific factors including timing of investments, additions or withdrawals, and individual restrictions.
This communication is not an offer to sell or solicitation of an offer to buy any securities. LUL is a registered investment advisor. For additional information about LUL, including fees and services, please refer to our Form ADV, available upon request.
Benchmark Data: SPY and RSP Sharpe Ratios are sourced from PortfoliosLab (December 2025) and represent trailing 12-month calculations. Industry benchmarks for active managers and hedge funds are based on published academic research and industry surveys.
Past Performance: Past performance is not indicative of future results. All investments involve risk, including possible loss of principal. The Sharpe Ratio is one of many metrics and should not be used in isolation for investment decisions.
© 2026 Life UnLocked Partners. All rights reserved. The "TACSIT Report" is proprietary to LUL and may not be reproduced or redistributed without prior written consent.